Business intelligence for roofing companies
What did the June hail storm cost us?
Ask your roofing data.
Get the whole story.
Knosys is the BI tool you talk to. Ask in plain English and get the chart back. Then follow a hail storm from margin to material cost to crews to warranty claims to shingle stock, across every branch.
Read the film’s transcript
- Instant operational intelligence.
- Ten roofing companies. Leadership waits days for the roll-up.
- Accounting exports. CRM records. ERP sheets. Supplier files.
- Knosys brings it all together, in one place.
- On June tenth, a hail storm crossed Fort Worth and Dallas. The quarter that followed tells the story.
- The quarter after the June hail storm is closed. What did it cost us?
- Asked: What was our gross margin for the whole group last quarter?
- Here is where group margin landed.
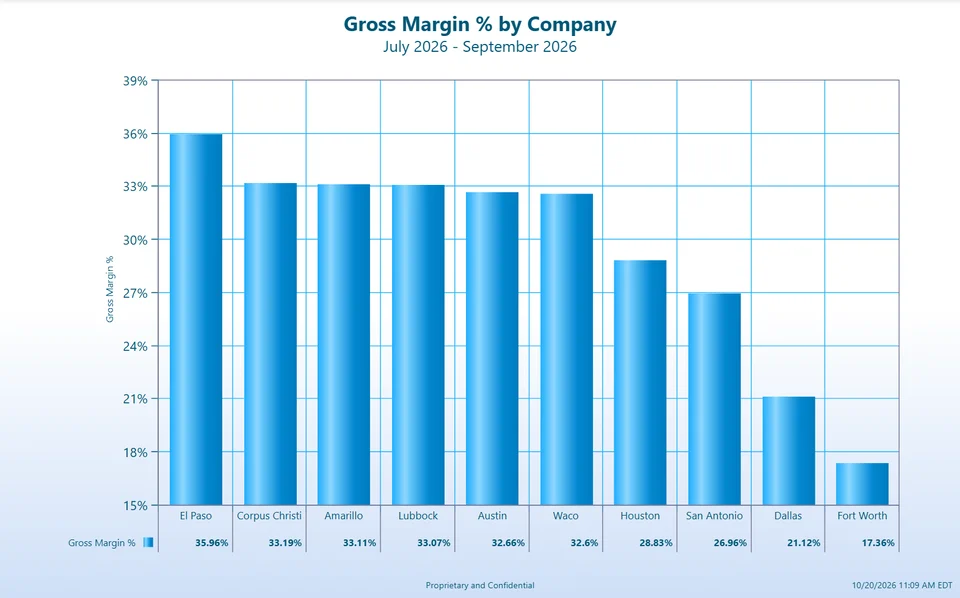
- Asked: What was gross margin for each of our ten companies last quarter, shown as bars?
- But two companies are far behind: Fort Worth and Dallas, right in the storm’s path.
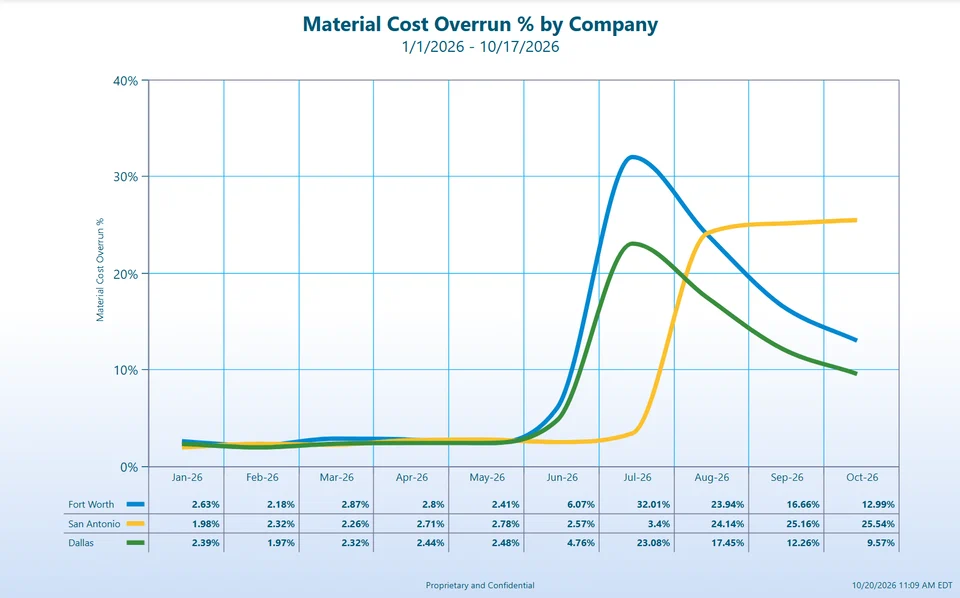
- Asked: Chart material cost overrun by month for Fort Worth, Dallas and San Antonio this year as curved lines.
- The reason: material costs ran well over estimate, Fort Worth first.
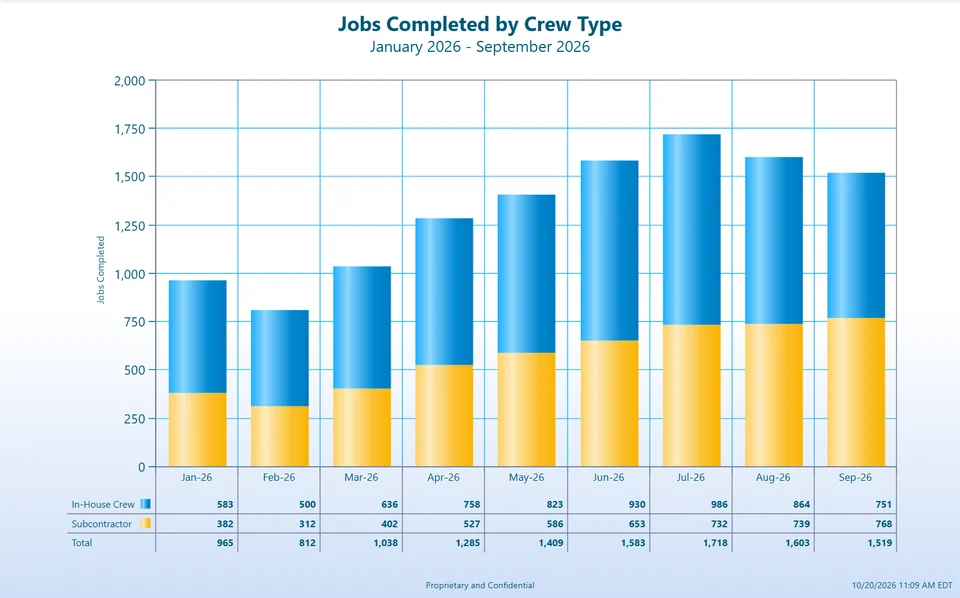
- Asked: How many jobs did each crew type complete by month from January to September, as stacked bars?
- Crews were stretched, and subcontractors took on more and more of the work.
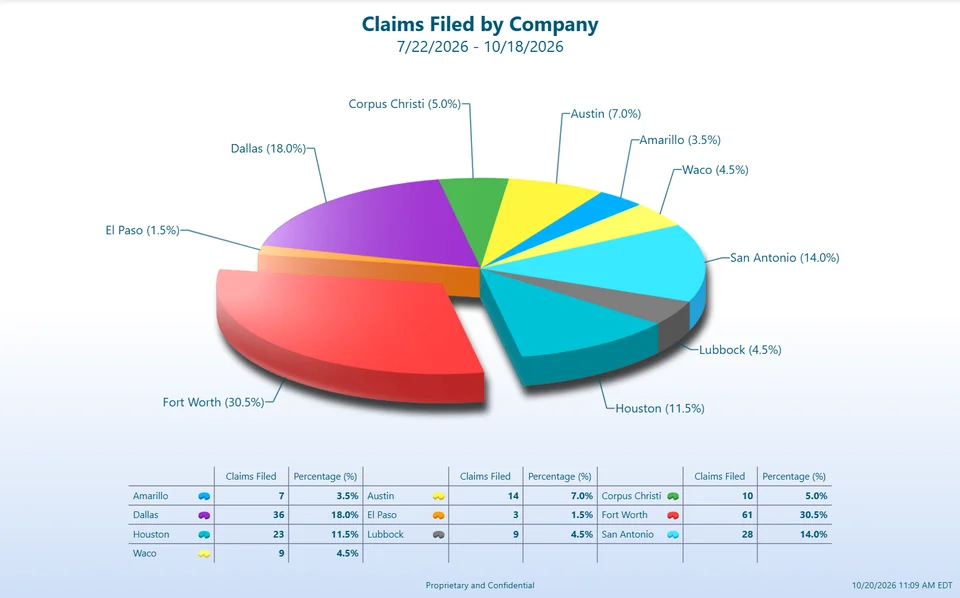
- Asked: Which companies have had the most warranty claims over the last 90 days, as a pie chart?
- Rushed roofs are coming back as warranty claims, mostly in Fort Worth.
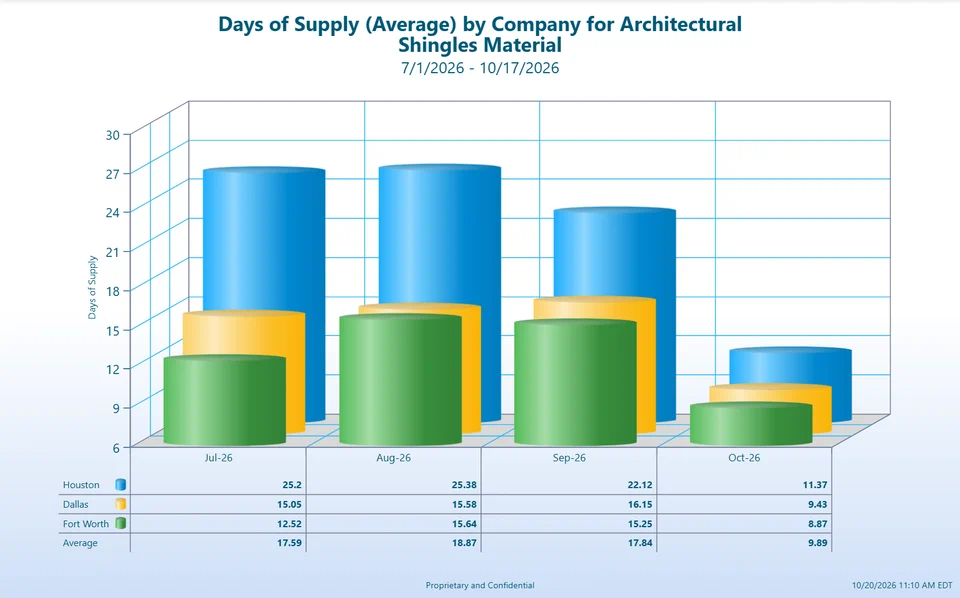
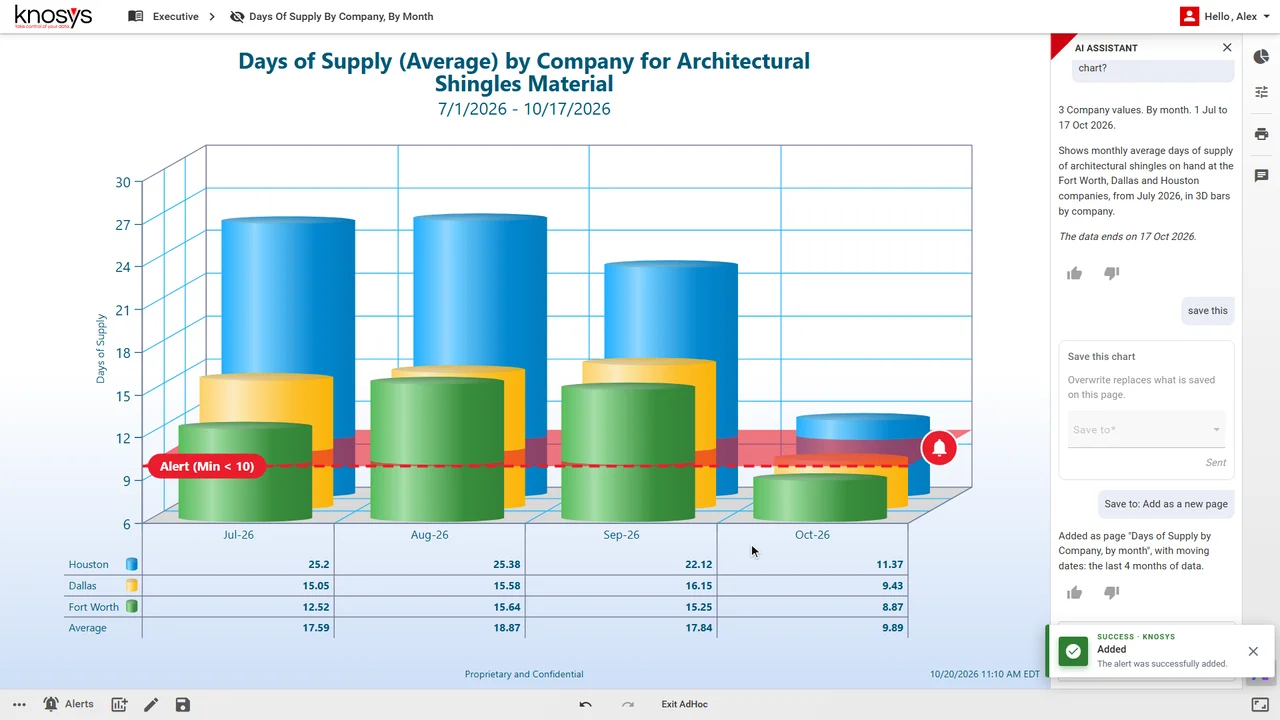
- Asked: How many days of architectural shingles did Fort Worth, Dallas and Houston have on hand by month since July, as a 3D bar chart?
- And the next risk is here: shipments have run short, and some companies are nearly out of shingles.
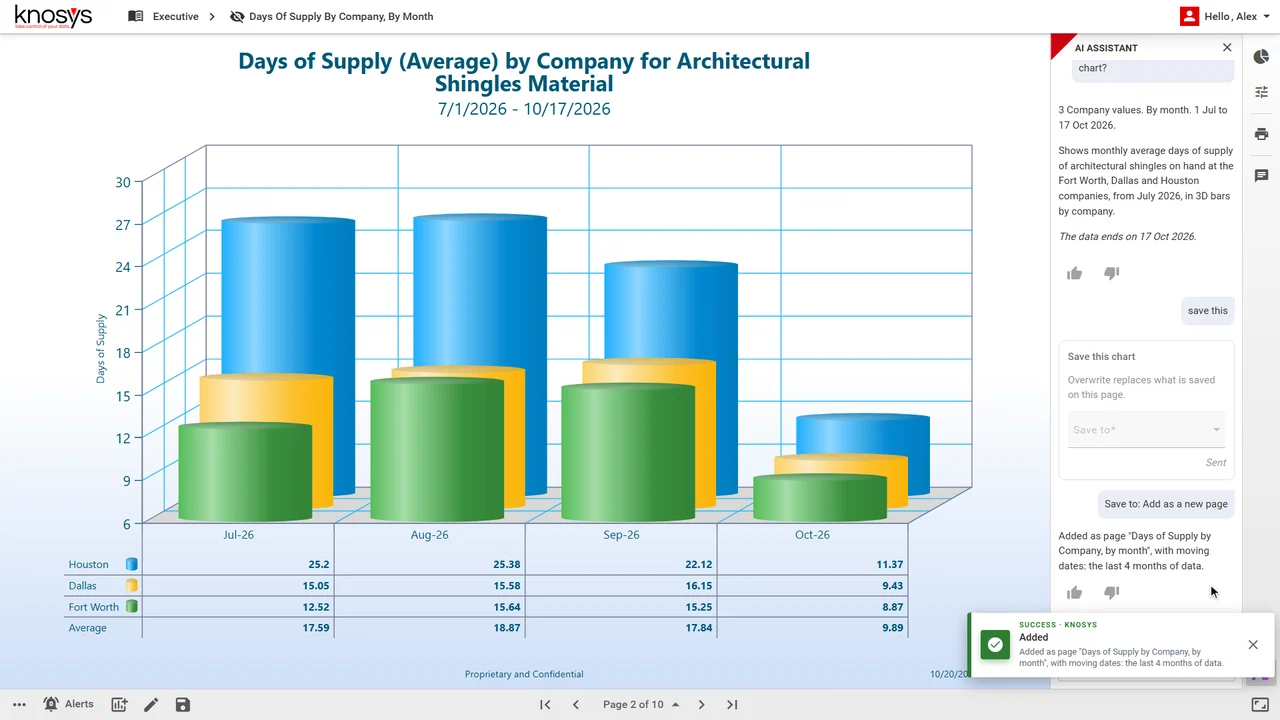
- Said: save this
- So save it, and set an alert: if any company runs low, the team hears first.
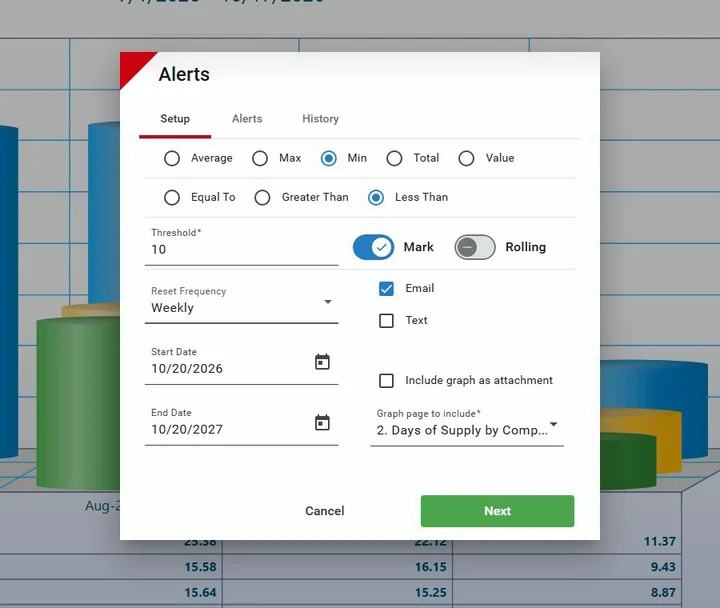
- On screen: the alert is set up: Min, Less Than, 10, by email, to Procurement & Supply and Regional Directors.
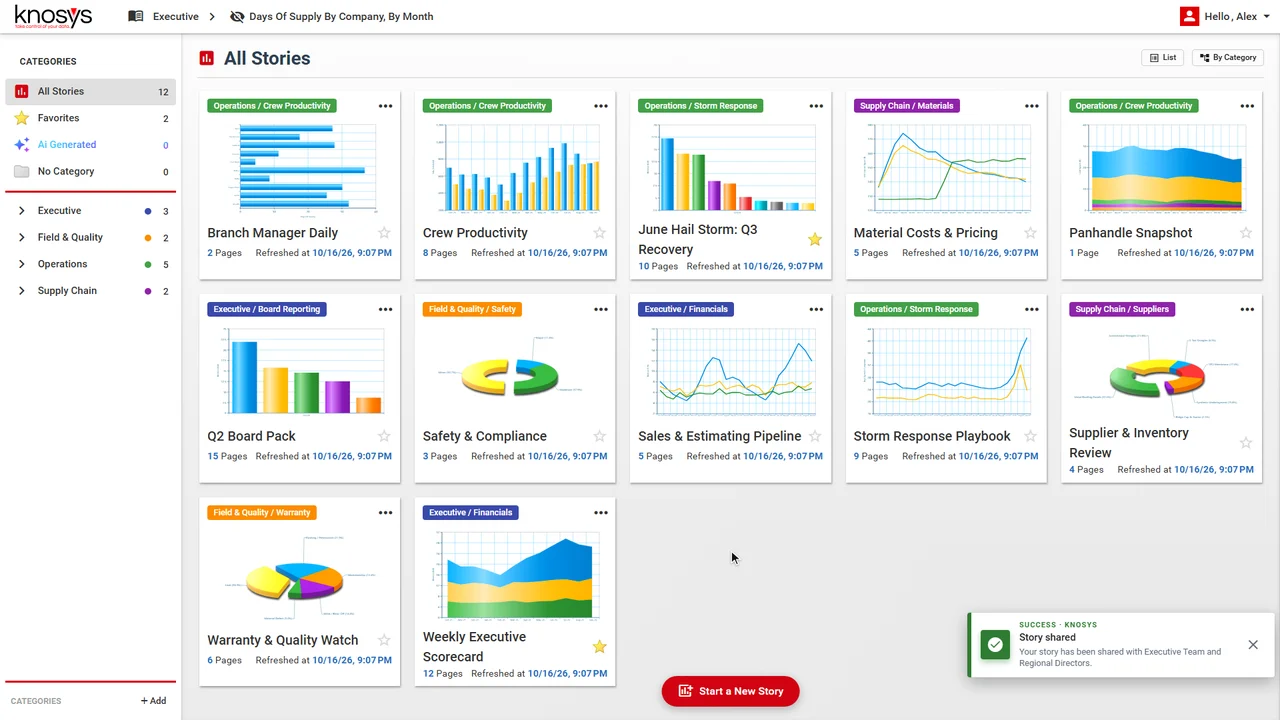
- On screen: the story is shared with the Executive Team and Regional Directors.
- Then share the story with the people who need it.
- From one storm to the whole story, just by asking.
- No more static reports built by hand. Knosys watches your numbers and tells leadership the moment one crosses a line.
- Ready-made connectors. Role-based security. Alerts that reach leadership first.
- See what Knosys looks like on your branch structure. Book a live architecture session.
- knosys.ai
The storm, one question at a time.
A roofing group with ten branches across Texas is the example. These are the questions its leaders asked, as they asked them.
-
CFO
What was our gross margin for the whole group last quarter?
One number for the whole group, without waiting for ten branches to send in their files.
Watch this moment 0:29 in the film: group margin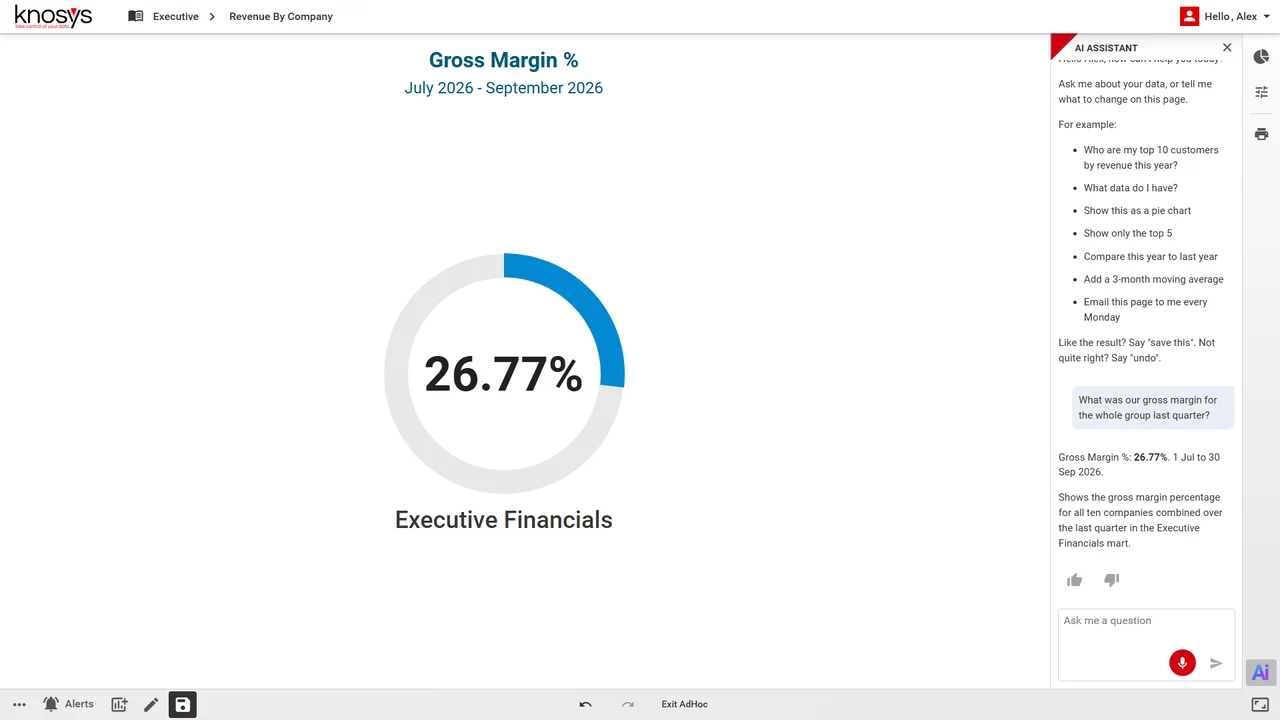
Illustrative data -
CFO
What was gross margin for each of our ten companies last quarter, shown as bars?
Two branches sit far below the rest, and you see it at a glance.
Watch this moment 0:37 in the film: margin by branch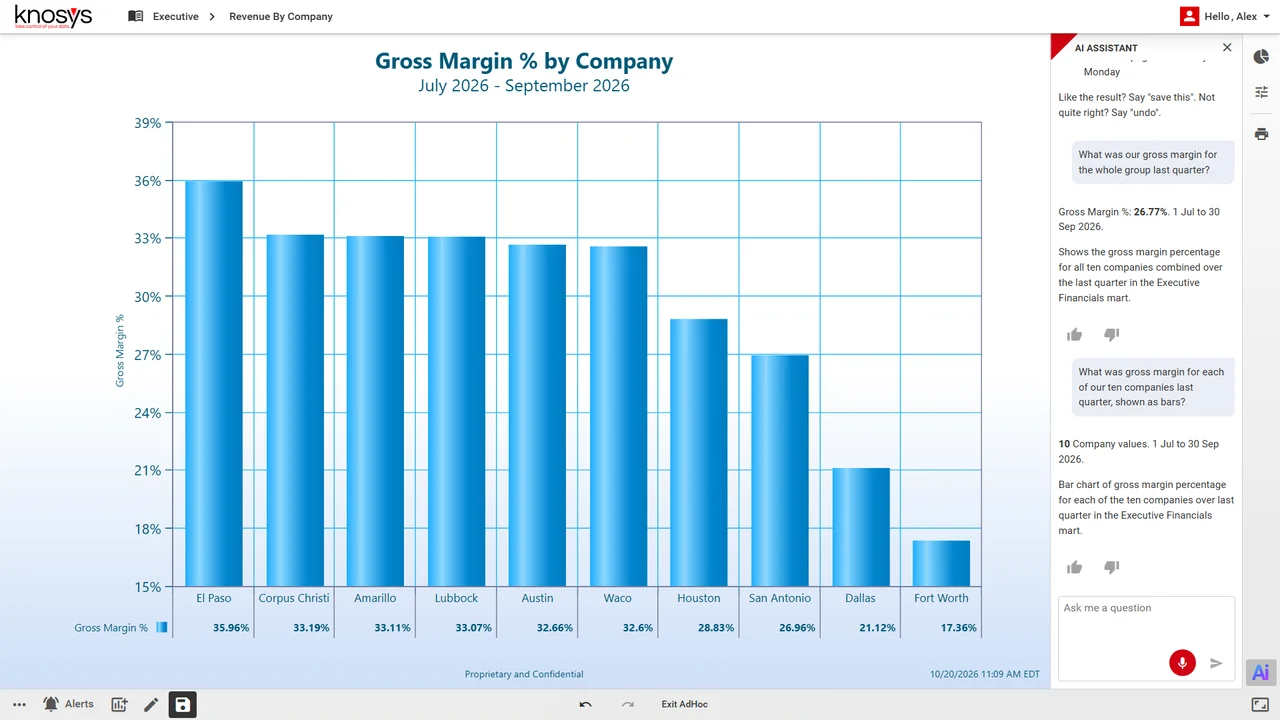
Illustrative data -
CFO
Chart material cost overrun by month for Fort Worth, Dallas and San Antonio this year as curved lines.
Then ask why: material costs ran over estimate, Fort Worth first.
Watch this moment 0:45 in the film: material cost overrun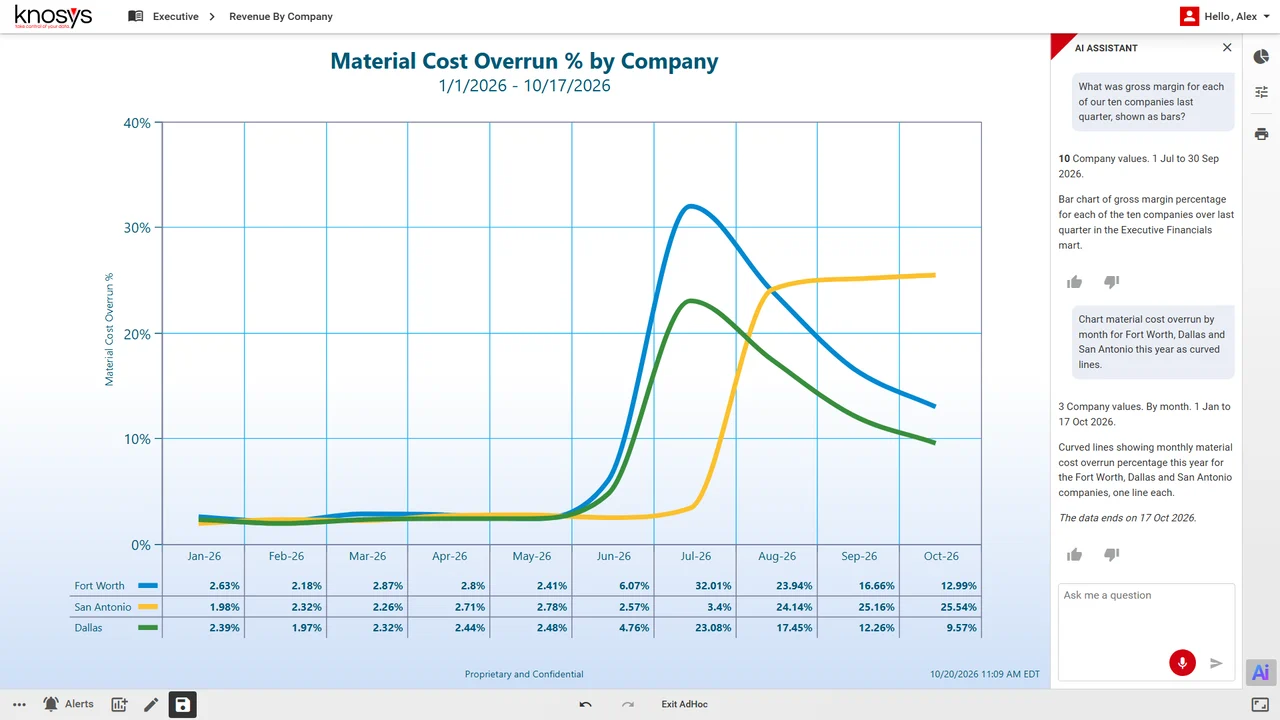
Illustrative data -
VP Operations
How many jobs did each crew type complete by month from January to September, as stacked bars?
Crews were stretched: subcontractors took on more.
Watch this moment 0:57 in the film: crews and subcontractors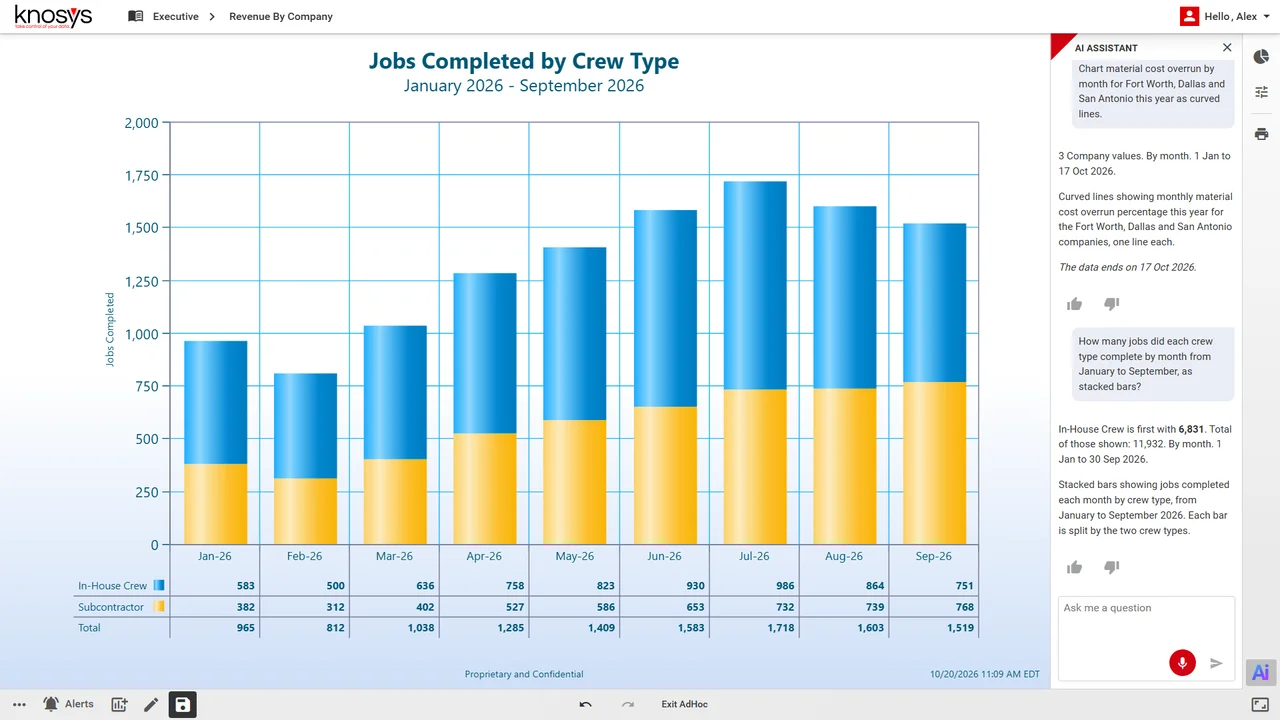
Illustrative data -
Branch manager
Which companies have had the most warranty claims over the last 90 days, as a pie chart?
Rushed roofs are coming back as warranty claims.
Watch this moment 1:07 in the film: warranty claims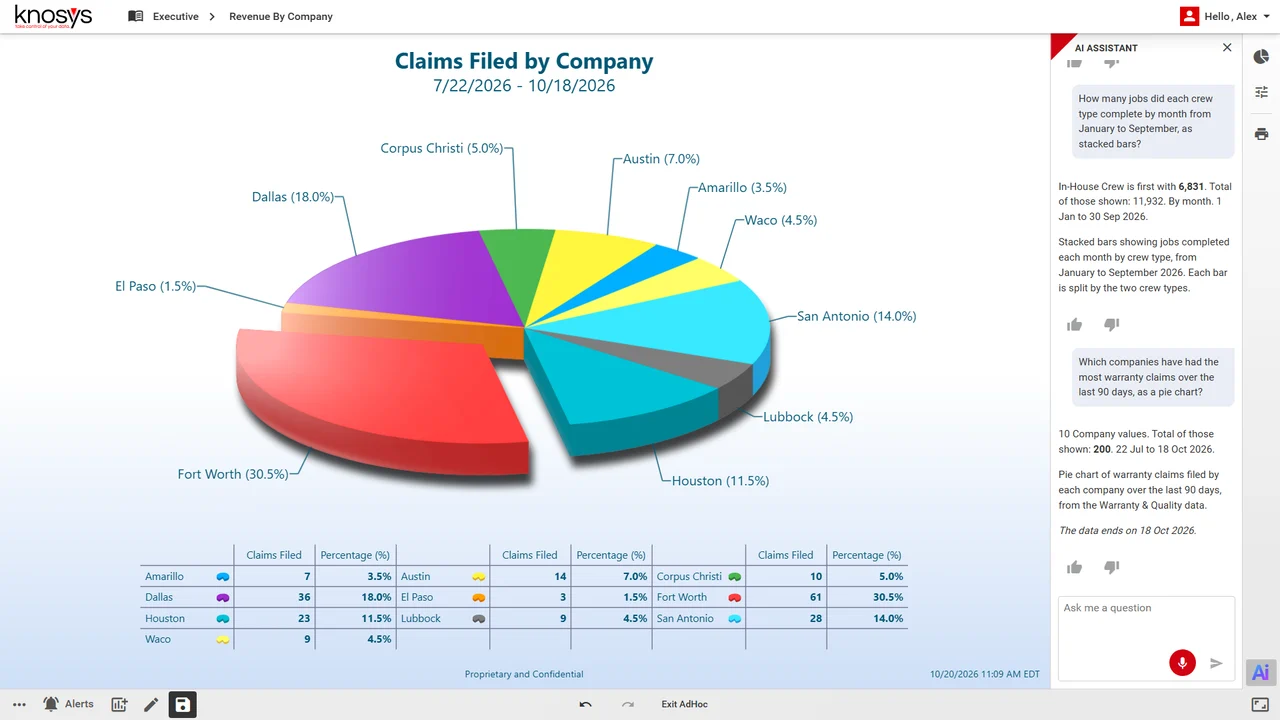
Illustrative data -
Branch manager
How many days of architectural shingles did Fort Worth, Dallas and Houston have on hand by month since July, as a 3D bar chart?
The next risk is already on the chart: shingle supply.
Watch this moment 1:17 in the film: shingle supply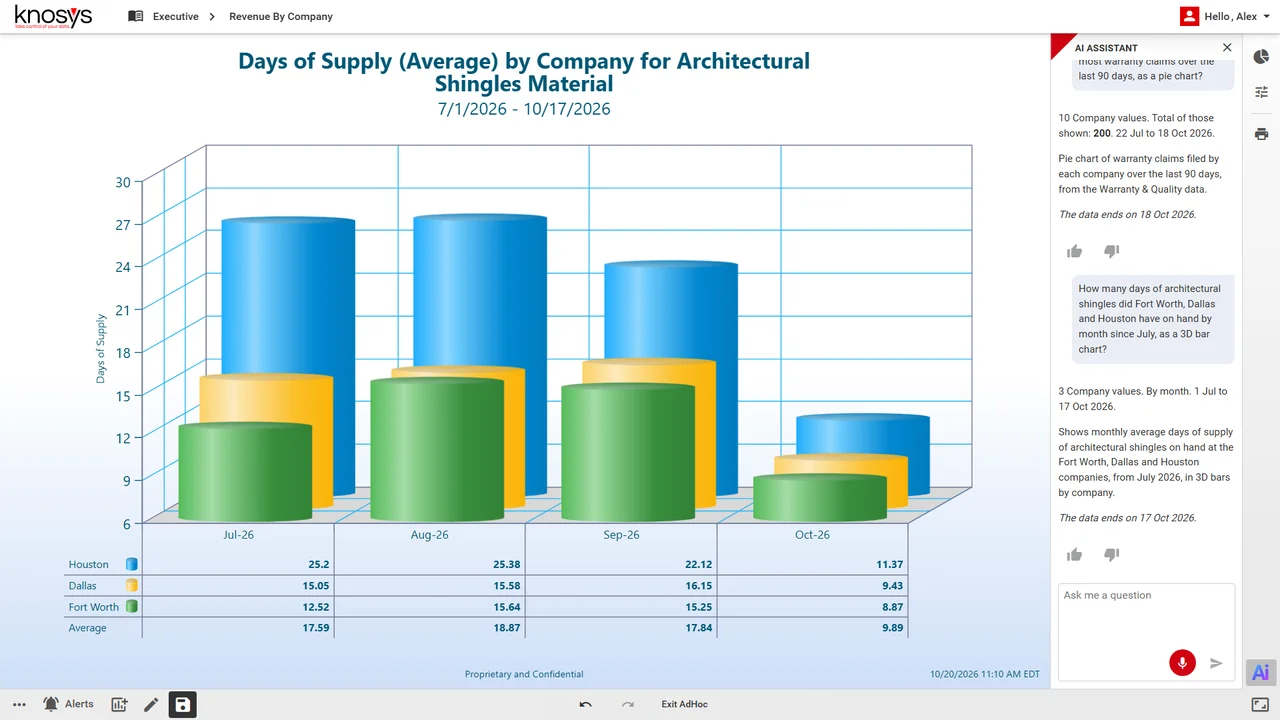
Illustrative data

Never be surprised twice.
-
Illustrative data Save it
Say “save this” and the page is kept, with dates that roll forward.
Watch this moment 1:31 in the film: saving the page -
Illustrative data Set the line
Pick the measure and the limit, here the lowest days of supply under 10. Knosys marks it on the chart, and you choose who is notified.
Watch this moment 1:38 in the film: setting an alert -
Illustrative data Share the story
Send the whole story, all ten pages, to the Executive Team and Regional Directors in one step.
Watch this moment 1:55 in the film: sharing the story
One question. Every system.
Your roofing software reports on itself. Knosys joins what it, your accounting, your ERP and your supplier files each know, and answers across all of it.
-
Where the numbers live
The usual wayAccounting exports, CRM records, ERP sheets and supplier files, each in its own place.
With KnosysOne data mart across them.
-
Getting an answer
The usual wayAsk the analyst, then wait for the roll-up.
With KnosysAsk in a sentence. The chart comes back.
-
Following a problem
The usual wayA new report request for every “why?”
With KnosysThe next question, in the same conversation: margin, material cost, crews, claims, supply.
-
Keeping it
The usual wayExport it, paste it, rebuild it next quarter.
With KnosysSay “save this”, with dates that roll.
-
Hearing about it
The usual wayAt the next review.
With KnosysSet the line, and choose who is notified.
-
Sharing
The usual wayA spreadsheet in an email.
With KnosysShare the story with the groups who need it.
“The usual way” describes how reporting commonly works across a roofing company’s systems; yours may differ.
Fair questions.
Anything else, ask us on a demo.
Is the data in the film real?
No. The product, the assistant and the screens are real; the company and the data are invented. The film is edited: the waits for the assistant are sped up and marked on screen, and the captions, a typing zoom and the voice are added afterwards. Each answer was checked against the data behind it.
Does Knosys work with the software roofing companies already use?
Knosys reads from files such as Excel and CSV, from databases and from APIs. If your accounting, CRM, estimating or supplier data can be exported or reached that way, it can be brought into one data mart. Tell us what you run and we will say exactly what it takes.
Our roofing software already has reports. Why Knosys?
Reports inside one system describe that system. Knosys joins the data across your systems and lets anyone ask it a question in plain English, then keep the answer, put a limit on it and share it.
Who can see what?
Knosys is role-based: permissions are set on every data mart, so people see the data they are meant to.
How long does it take to get started?
It depends on your sources, so we do not put a number on it here. The live session starts from your branch structure and the questions you want answered.
What does it cost?
Every plan is the whole product; plans differ only in their limits. See the plans.
Does it only work for hail, or for Texas?
No. The storm is the example. Hail, wind, a hurricane or a supplier’s price change each leave a trail across margin, cost, crews, claims and stock, and you follow it the same way: by asking.
See Knosys on your
branch structure.
A live session on your own branches. Your data, or ours.
Or write to [email protected].