Business intelligence for construction companies
Which branch is running over on materials?
Built for construction
companies that run
on numbers.
Construction leaders chase the same five numbers across every branch, and they live in different systems. Knosys brings them together, so anyone can ask about any of them in plain English and get the chart back.
- Job margin
- Material cost
- Crews & subcontractors
- Warranty claims
- Supply on hand
What construction
leaders ask.
Five questions, each answered with a chart. They come from the roofing demo; ask yours the same way.
-
CFO
How is job margin holding up across our branches?
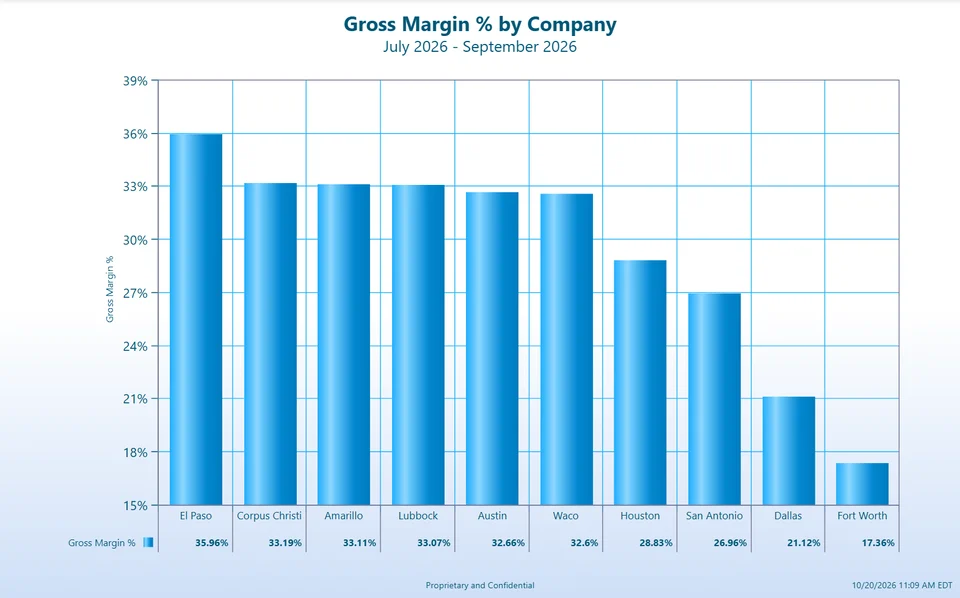
From the roofing demo · Illustrative data See which branches earn less than the rest, in one chart.
See it in the roofing demo -
CFO
Where is material cost running over estimate?
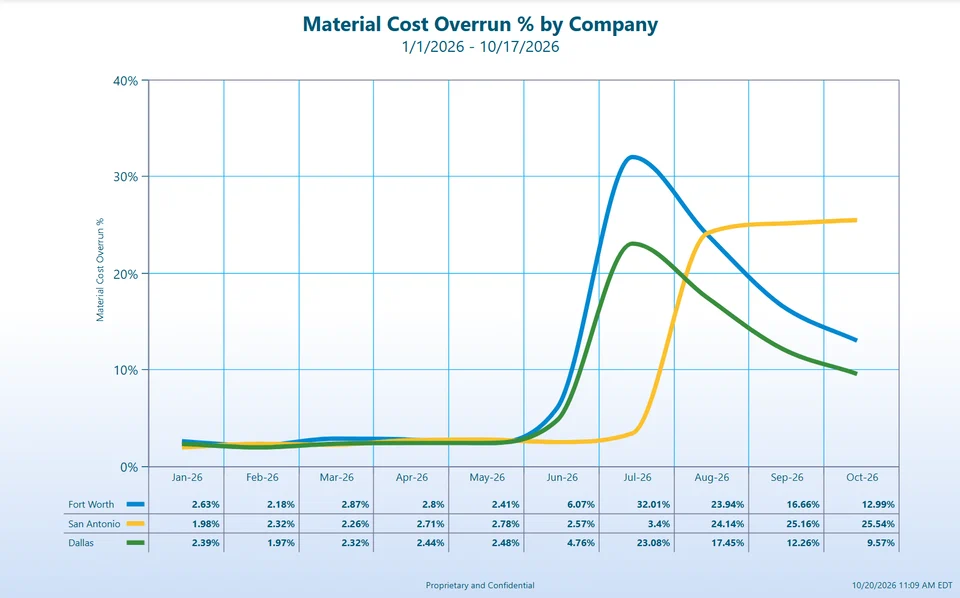
From the roofing demo · Illustrative data Follow the overrun month by month, branch by branch.
See it in the roofing demo -
VP Operations
Are our crews and subcontractors keeping up with the work?
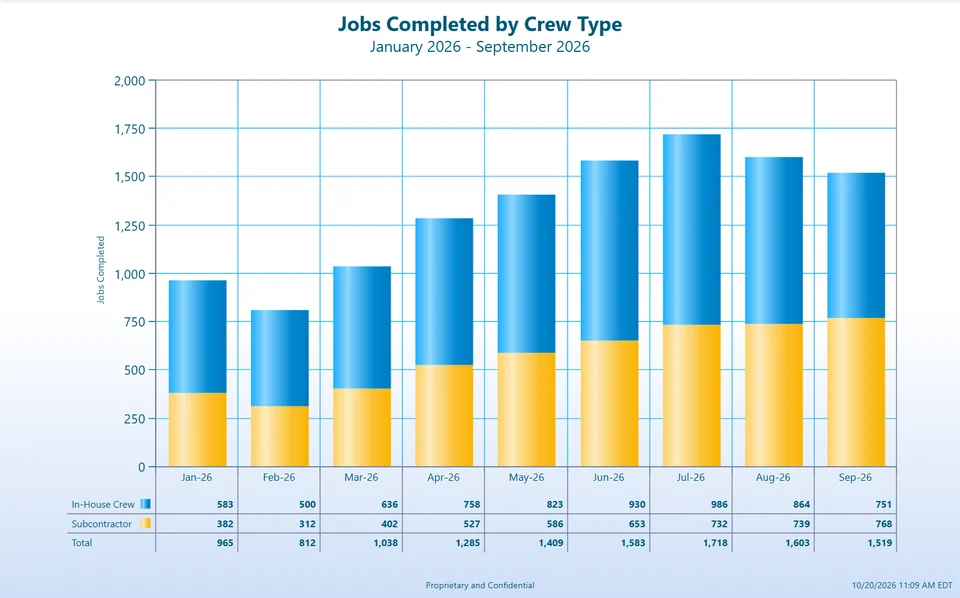
From the roofing demo · Illustrative data Set your own crews beside the subcontractors, month by month.
See it in the roofing demo -
Branch manager
Which branches have the most warranty claims?
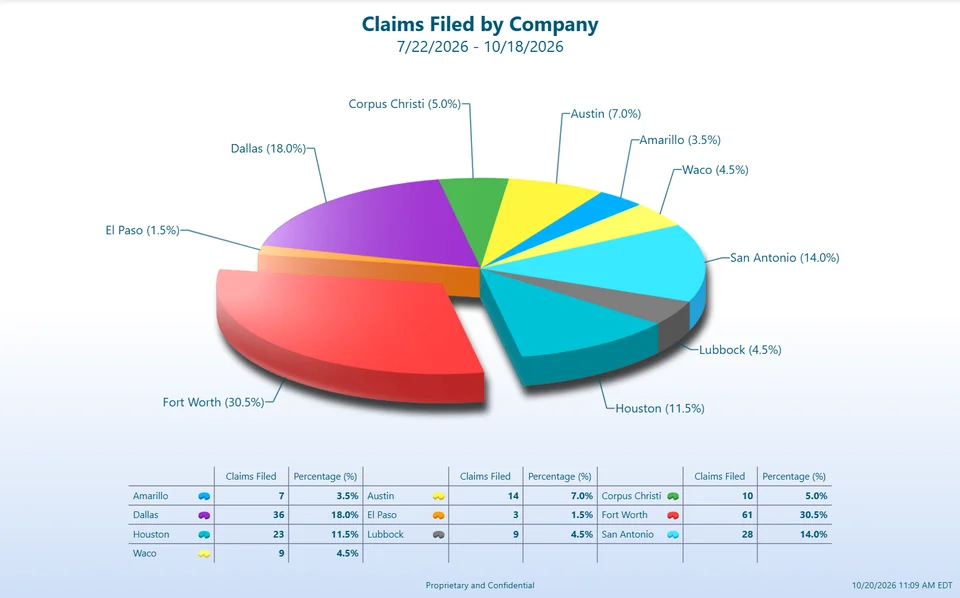
From the roofing demo · Illustrative data Spot where finished work is coming back.
See it in the roofing demo -
Branch manager
How many days of material do we have on hand?
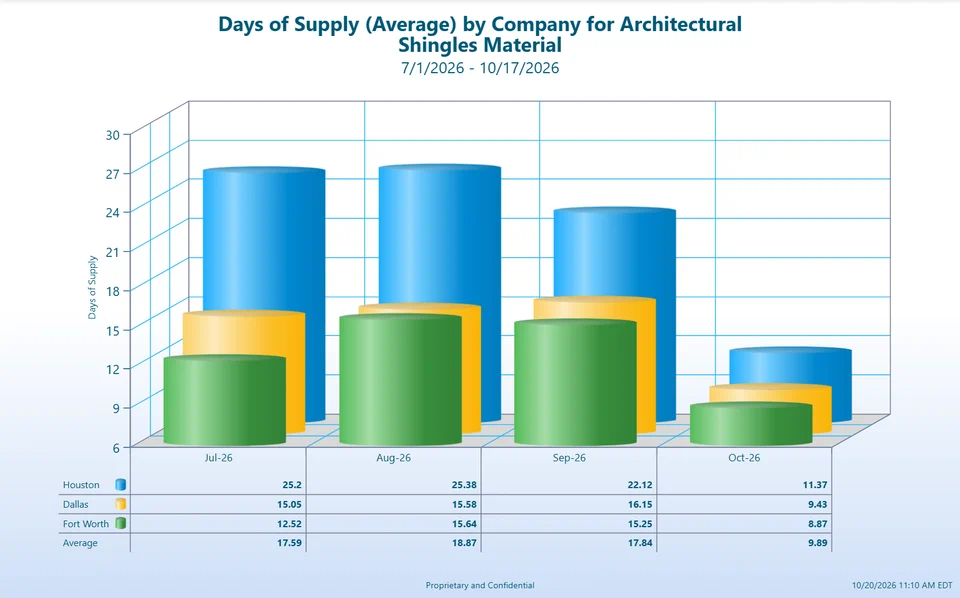
From the roofing demo · Illustrative data Watch supply on hand, by branch and month.
See it in the roofing demo -
Bring your own question.
Book a Demo
Find your trade.
Roofing is the first demo, recorded in the real Knosys product. More trades are on the way.
-
Live demo
Roofing
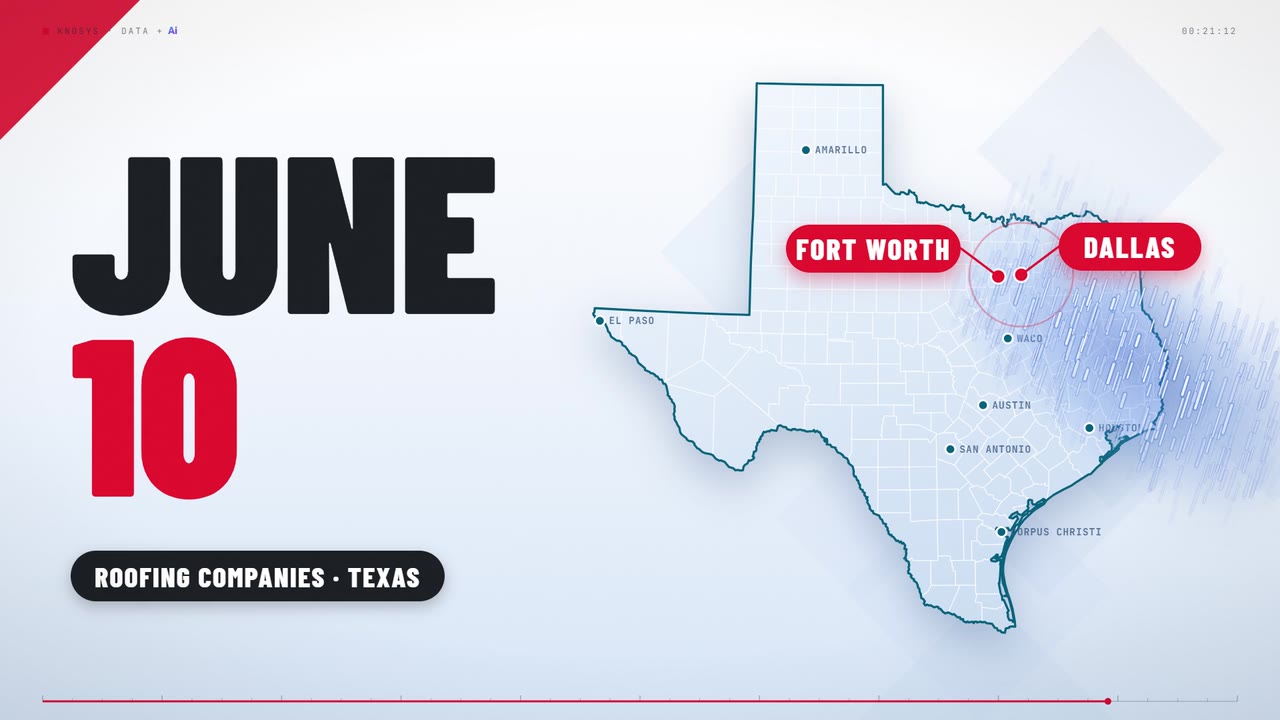
A Texas roofing group, one hail storm, and the questions its leaders asked.
Watch the demo -
Coming
More trades are on the way.
Tell us yours, and the first question you would ask.
Tell us yours
Bring a question
from your branches.
Book a live session and ask your own first question. Your data, or ours.
Or write to [email protected].